Course Review: Probability and Statistics by Stanford Online
In order to brush up my math skills, I started the Probability and Statistics by Stanford Online. I found it via the Free online machine learning curriculum by Chip Hyuen. If you do not know her, make sure to read her blog and books!
Sadly, the online platform that hosted the course will shut down. Hopefully, the course is hosted somewhere else, e.g. Open edX . I will update this post once I know more!
Content
The following is copied from the course description:
In a nutshell, what statistics is all about is converting data into useful information. Statistics is > therefore a process in which we
- Collect data
- Summarize data
- Interpret data
To really understand how this process works, we need to put it in a context. We will do that by introducing one of the central ideas of this course — the Big Picture of Statistics. We will introduce the Big Picture by building it gradually and explaining each step. At the end of the introductory explanation, once you have the full Big Picture in front of you, we will show it again using a concrete example.

There are four main sections: First is exploring the data, that is examining distributions and relations via tools like graphs or statistical measures (mean, variance, range, IQR, outliers). Then, sampling and how to design studies to produce data from the overall population is discussed. After that, a basic but very intuitive introduction to probability is given, including conditional probability and independence as well as random variables. The last and longest chapter is about inference, that is using the data to draw conclusions. Focus is mostly on confidence intervals and hypothesis testing.
Format
The course is targeted at beginners and assumes next to no background in math or statistics. It reads to me most like a Ipython notebook: each chapter starts with an exposition and learning goal. Between each sections are many (!) exercises that check whether you understood the material. Some are graded automatically (numeric and multiple choice), some are free text where you have to grade yourself. Questions are typically repeated with different examples so that you are really pushed to understand. I really like this format, as it gives you instant feedback. Every section and chapter has a summary. There are many examples and case studies.
Every topic gets sliced in nice manageable chunks to cover all aspects, one after another. For instance, when examining relationships, all different combinations of two variables are discussed (categorical vs. quantitative), giving a recipe for each. The same is for hypothesis testing, where every statistical test is motivated by the kind of variables are given and not the other way round, giving intuitive sense why this test should be used.
For some topics, there are videos and interactive graphics you can play with. There are many examples and many datasets that will be used throughout the course. Some exercises require statistical software, I went with R but there are also instructions for Statcrunch, TI Calculator, Minitab, or Excel.
At the end of some chapters, there is a program called StatTutor. It is an interactive exercise that, given a dataset and certain questions, e.g. “Is there a relationship between students’ college GPAs and their high school GPAs?”, goes step by step through the statistics cookbook to solve the problem really thoroughly. While sometimes a bit tedious and small-stepped, it helps to actually apply the learned material in a final problem.

Progress
I started the course on the 27th of October 2019 and finished it on the 29th of February 2020, taking me 125 days. There are in total 18 chapters with 881 questions. That means I finished around one chapter per week. During that time, I was sick twice, wrote a paper and celebrated the holiday season so I find the pace reasonable. I do not know how the course normally would be offered in university, I would see it possible that it is also taught one chapter per week. I find that I do not want to crunch this course, one needs a break and reflect. The end especially is much denser and longer than the beginning.
Conclusion
During my education, the focus was always much more on probability than on statistics and data science, therefore I learned and rediscovered many new things in this course.
Sometimes, questions are tedious and repeat themselves which is good for learning but sometimes difficult to keep up with. For me, sometimes, depth is missing, especially derivations and maths. I would love to have optional links to how the formulas are derived.
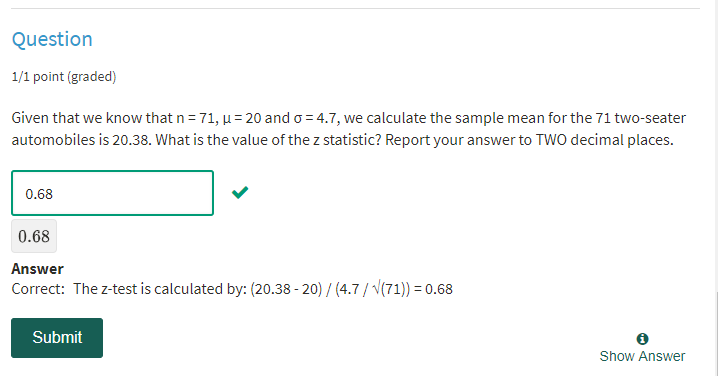
The course heavily relies on statistical packages and requires next to no computation by hand. This is good for beginners but hides a lot. For instance, in hypothesis testing, often the z or t-statistic is computed but the way to obtain the p-value for it is left to software.
I wish I had taken this course before I started my PhD; it would have been very useful even for my last paper. In high school and university, I was already taught most of the material, but I forgot a large share of it because I was not too interested in it back then. But now that I do my own research, collect my own data and need to do statistical analysis of it, proper knowledge about data science is more relevant than ever. This is especially for hypothesis testing, as I need to conduct user studies whose analysis requires sound statistical treatment.
If the course is online after the closing of Lagunita, I can definitely recommend to take it. Even though it is quite basic, it helps you brushing up all the foundations for statistics and probability, explains it very thoroughly and covers all the areas. It guides you, holds you by the hand and repeats the topics until you really got them.